Back to:
Table of content:
ODS data analysis
Tran The Trung, Service d'Aeronomie, CNRS, France
Mars, 2006
Introduction
This document explains the steps to obtain scientific results out of ODS raw measurements.
In the first step, it is adviced that one visualize the raw measurement before further treatment.
Each ODS channel is an optical system having 1 symmetric axis, called s. In ideal operation, s point to the zenith. In reality, s makes some small angle to the zenith, which can be characterized by 2 parameters:
- φ : azimuth angle of s
- θ : zenith angle of s
Further more, error of ODS manufacturing could results in a FOV with mask rotated by a small angle around the symmetric axis:
- ψ : rotational angle of FOV arround s
The purpose of this section is to determine φ, θ and ψ from ODS measurement for each channel, given accurate knowledge of Sun (or Moon, in the case of observation on Earth during nightime) ephemeris.
Atmospheric models contains fixed parameters and variable parameters.
The variable parameters can be:
The fixed parameters can be:
- Wavelength: Normally, one could choose the wavelength correspond to the maximum of the channel reponse curve, which is the product of
channel filter spectrum, photodiode response and solar spectrum.
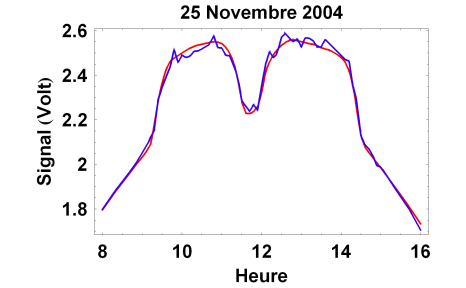 Figure 1. Example of fitting with daytime 870nm signal from sunlight at Ouagadougou, Burkina Faso, 25 November 2004; where observation is shown in blue, best fit simulation (τ=0.8±0.02) is shown in red.