Back to:
Table of content:
- Channel 1 (blue) filters: (CSV data)
BG12 filter - UG1 filter
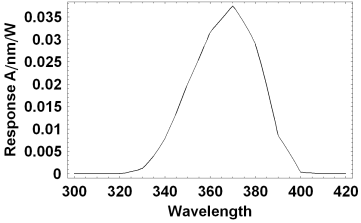 Figure 1. Overal spectral response (photodiode current, A, per wavelength, nm, and photon flux, W) in channel 1.
- Channel 2 (red) filters: (CSV data)
RG780 filter - Density 1.0 filter
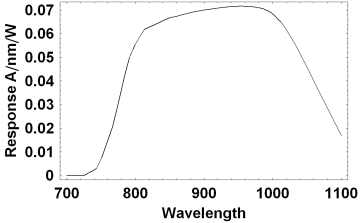 Figure 2. Overal spectral response (photodiode current, A, per wavelength, nm, and photon flux, W) in channel 2.
-
Channel 1 Field of View (FOV) (CSV data compressed by Gzip)
 Figure 3. Visualization of FOV in channel 1.
-
Channel 2 Field of View (CSV data compressed by Gzip)
 Figure 4. Visualization of FOV in channel 2.
CSV data compressed by Gzip.
-
Channel 1:
-
φ = 25 ± 2. °
-
θ = -0.8 ± 0.1 °
-
ψ = 3.4 ± 0.1 °
-
Channel 2:
-
φ = 1. ± 2. °
-
θ = 0.0 ± 0.1 °
-
ψ = 3.8 ± 0.1 °
Optical depth results (CSV data)
-
Aerosol Optical Thickness (AOT) at 870nm
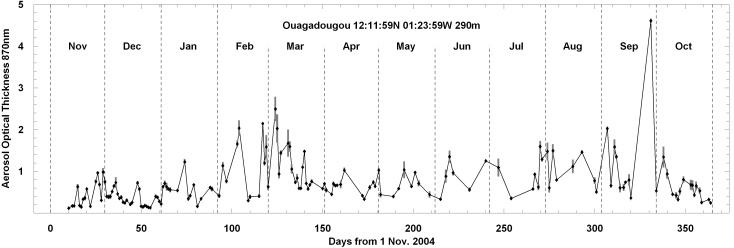 Figure 5. Daily averaged optical depth at 870nm, with error bars, measured by ODS at Ouagadougou, Burkina Faso, between November 2004 to October 2005. Only selected results with uncertainty less than 20% are shown.
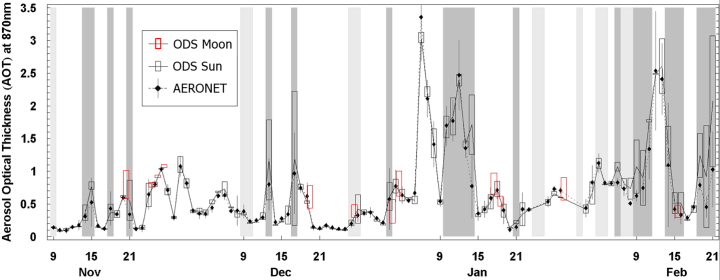 Figure 6. Comparison between ODS and daily averaged AERONET (data level 1.0) optical depth at 870nm, for the dry season between November 2004 to February 2005. ODS data are shown by a solid line and empty boxes as error bars while the AERONET daily averages are shown by diamonds with error bars corresponding to the standard deviation of the measurements. The dark gray vertical bands indicate "cloudy days" (square root of minimum of χ2 per ODS measurement point exceed 0.1 V), while the light gray bands indicate days where large portions of ODS data are missing because of failure of electric power.
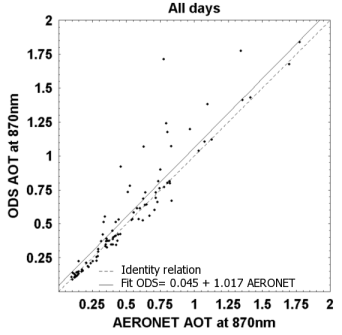
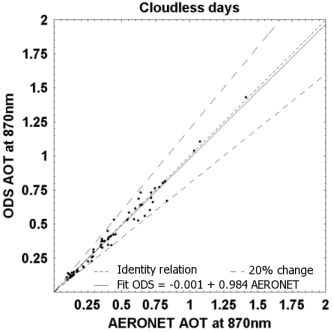 Figure 7. Correlation between ODS and daily averaged AERONET (data level 1.0) optical depth at 870nm, for the dry season between November 2004 to February 2005; for all data available in the first figure and for "cloudless days" (square root of minimum of χ2 per ODS measurement point less than 0.1 V) in the second one.